

Executive summary
This article series provides a monthly dashboard of industries in each sector of the GICS classification. It compares valuation and quality factors relative to their historical averages.
Biotechnology looks significantly underpriced relative to historical averages for 3 valuation ratios, but the profitability metric is below the historical baseline. Ratios are mixed for pharmaceuticals: price/earnings is close to the historical average, price/free cash flow is excellent, but price/sales and return on equity are very bad. Other healthcare industries are significantly overvalued. Combining all metrics, healthcare equipment is the worst-looking group in the sector. Life science tools/services is the only healthcare industry above its profitability baseline, which may partly justify overvaluation.
Since last month:
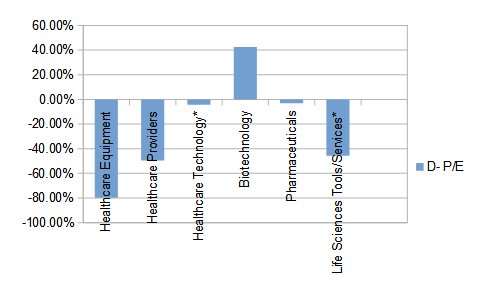
- P/E has improved in HC technology, biotechnology and deteriorated in HC providers, pharmaceuticals.
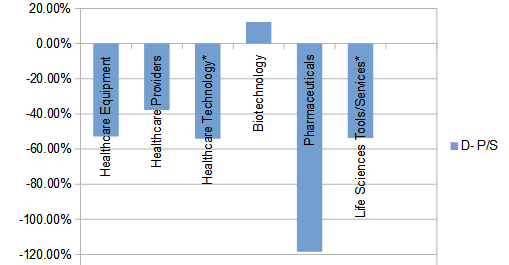
- P/S has improved in biotechnology, pharmaceuticals, life science tools/services.
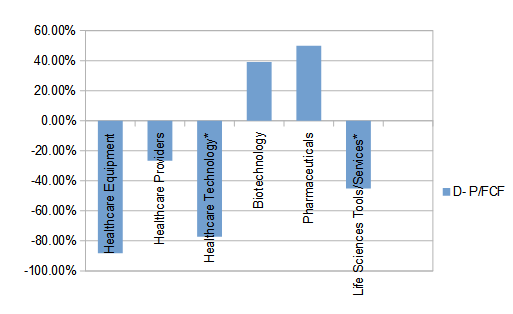
- P/FCF has improved in life science tools/services and deteriorated in HC equipment, HC providers, HC technology.
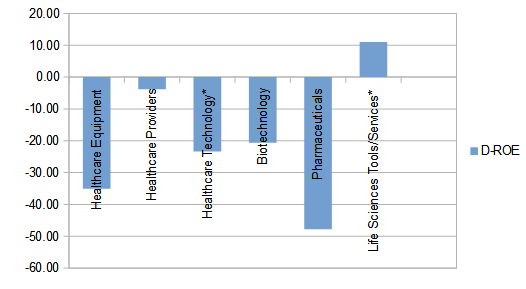
- ROE has improved in HC providers, pharmaceuticals, life science tools/services and deteriorated in HC technology, HC equipment.
- In 1 trailing month, the SPDR Select Sector Healthcare ETF (XLV), the Nasdaq Biotechnology ETF (IBB) and the SPDR Biotech ETF (XBI) have lagged the SPDR S&P 500 ETF (NYSEARCA:SPY) by about 0.8%, 4.8% and 5.8%.
- The five best performers among S&P 500 healthcare stocks in this period are Align Technology Inc. (ALGN), Henry Schein Inc. (HSIC), IDEXX Laboratories Inc. (IDXX), McKesson Corp. (MCK), ResMed Inc. (RMD).
Some cheap stocks in their industries
The stocks listed below are in the S&P 1500 index, cheaper than their respective industry factor for price/earnings (excluding extraordinary items), price/sales and price/free cash flow. The 10 companies with the highest return on equity are kept in the final selection. Quantitative Risk & Value Members have an early access to the stock lists every month before they are published in free articles. This is not investment advice. Do your own research before buying. The list was published for subscribers at the beginning of the month based on data available at this time.
|
Amgen Inc. |
BIOTECH |
|
|
Biogen Inc. |
BIOTECH |
|
|
Celgene Corp. |
BIOTECH |
|
|
Exelixis Inc. |
BIOTECH |
|
|
Regeneron Pharmaceuticals Inc. |
BIOTECH |
|
|
Lantheus Holdings Inc. |
HCAREEQSUPP |
|
|
AmerisourceBergen Corp. |
HCAREPROVID |
|
|
Corcept Therapeutics Inc. |
PHARMA |
|
|
Nektar Therapeutics |
PHARMA |
Detail of valuation and quality indicators in healthcare on 5/15/2019
I take 4 aggregate industry factors: price/earnings (P/E), price to sales (P/S), price to free cash flow (P/FCF), return on equity (ROE). My choice has been justified here and here. Their calculation aims at limiting the influence of outliers and large caps. They are reference values for stock picking, not for capital-weighted indices.
For each factor, I calculate the difference with its own historical average: to the average for valuation ratios, from the average for ROE, so that the higher is always the better. The difference is measured in percentage for valuation ratios, not for ROE (already in percentage).
The next table reports the 4 industry factors. There are 3 columns for each factor: the current value, the average (“Avg”) between January 1999 and October 2015 taken as an arbitrary reference of fair valuation, and the difference explained above (“D-xxx”).
|
P/E |
Avg |
D- P/E |
P/S |
Avg |
D- P/S |
P/FCF |
Avg |
D- P/FCF |
ROE |
Avg |
|
|
Healthcare Equipment |
48.89 |
27.18 |
-79.88% |
4.86 |
3.18 |
-52.90% |
57.43 |
30.51 |
-88.23% |
-47.24 |
-12.14 |
|
Healthcare Providers |
31.21 |
20.88 |
-49.47% |
1.17 |
0.85 |
-37.73% |
22.48 |
17.75 |
-26.67% |
1.99 |
5.78 |
|
Healthcare Technology* |
58.54 |
56.13 |
-4.29% |
5.23 |
3.39 |
-54.20% |
63.42 |
35.77 |
-77.31% |
-29.60 |
-6.2 |
|
Biotechnology |
22.86 |
39.78 |
42.53% |
25.43 |
29.01 |
12.35% |
26.65 |
43.74 |
39.08% |
-85.01 |
-64.42 |
|
Pharmaceuticals |
27.06 |
26.26 |
-3.05% |
18.03 |
8.25 |
-118.50% |
16.32 |
32.55 |
49.85% |
-78.09 |
-30.3 |
|
Life Sciences Tools/Services* |
42.99 |
29.52 |
-45.61% |
5.21 |
3.39 |
-53.70% |
39.62 |
27.28 |
-45.23% |
-7.33 |
-18.37 |
* Averages since 2006
The following charts give an idea of the current status of 3 valuation factors (P/E, P/S, P/FCF) and a quality factor (ROE) relative to their historical average in each industry. For all factors, the difference to average is calculated in the direction where positive is good. For valuation ratios, lower is better, for ROE, higher is better. On the charts below, higher is always better.
Price/earnings relative to historical average:
Price/sales relative to historical average:
Price/free cash flow relative to historical average:
ROE relative to historical average:
Momentum
The next chart compares the price action of XLV, XBI, IBB with the benchmark in 1 month.
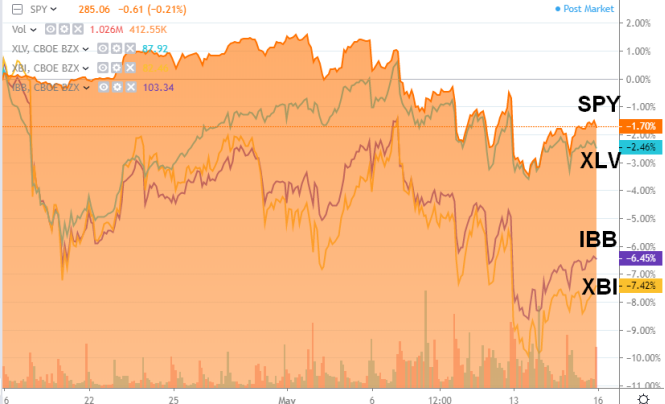
Chart by TradingView
Most of my stock holdings are based on quantitative value models. However, value is a bad timing indicator. Quantitative Risk & Value (QRV) provides you with a more realistic quantitative approach, for a world of probabilities instead of just risk on/risk off. It includes a systemic risk indicator and strategies based on it. Get started with a two-week free trial and see how QRV can improve your investing decisions.
Disclosure: I am/we are long BIIB,CELG,EXEL. I wrote this article myself, and it expresses my own opinions. I am not receiving compensation for it (other than from Seeking Alpha). I have no business relationship with any company whose stock is mentioned in this article.


